Figure 3
Use of MicroRNAs to Screen for Colon Cancer
Farid E Ahmed*, Nancy C Ahmed, Mostafa Gouda and Chris Bonnerup
Published: 31 August, 2017 | Volume 1 - Issue 1 | Pages: 045-074
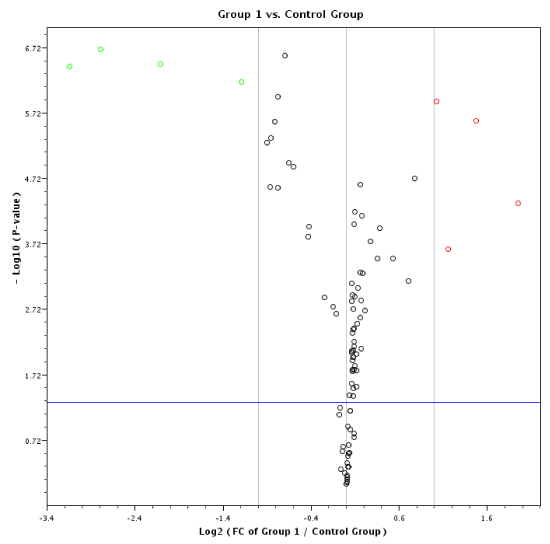
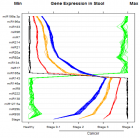
Figure 3:
MicroRNA expression in stool samples taken from 60 healthy and colon cancer individuals. The stage of cancer is indicated by the bottom row of the panel. There were 20 normal healthy individuals, and 40 with colon cancer (TNM stages 0 to 4). Instances of high expression appear on the right and those with low expression on the left. Expression by stem-loop RT-minor grove binding qPCR was measured by the CP or the E-method on a Roche LightCycler® 480 PCR instrument. Scales were chosen so the minimum values line up on the “Min” mark labeled at top left of the panel. The same is true for the maximum values, which line up under the mark labeled “Max” at top right of the panel.
Read Full Article HTML DOI: 10.29328/journal.hjbm.1001006 Cite this Article Read Full Article PDF
More Images
Similar Articles
-
Surface Plasmon Resonance technology to assess biological interactionsSilvia Bartollino*,Alessandro Medoro,Donatella Mignogna,,Erika di Zazzo,Bruno Moncharmont. Surface Plasmon Resonance technology to assess biological interactions . . 2017 doi: 10.29328/journal.hjbm.1001005; 1: 039-044
-
Use of MicroRNAs to Screen for Colon CancerFarid E Ahmed*,Nancy C Ahmed,Mostafa Gouda,Chris Bonnerup. Use of MicroRNAs to Screen for Colon Cancer . . 2017 doi: 10.29328/journal.hjbm.1001006; 1: 045-074
Recently Viewed
-
Advancing Forensic Approaches to Human Trafficking: The Role of Dental IdentificationAiswarya GR*. Advancing Forensic Approaches to Human Trafficking: The Role of Dental Identification. J Forensic Sci Res. 2025: doi: 10.29328/journal.jfsr.1001076; 9: 025-028
-
Scientific Analysis of Eucharistic Miracles: Importance of a Standardization in EvaluationKelly Kearse*,Frank Ligaj. Scientific Analysis of Eucharistic Miracles: Importance of a Standardization in Evaluation. J Forensic Sci Res. 2024: doi: 10.29328/journal.jfsr.1001068; 8: 078-088
-
Sinonasal Myxoma Extending into the Orbit in a 4-Year Old: A Case PresentationJulian A Purrinos*, Ramzi Younis. Sinonasal Myxoma Extending into the Orbit in a 4-Year Old: A Case Presentation. Arch Case Rep. 2024: doi: 10.29328/journal.acr.1001099; 8: 075-077
-
Toxicity and Phytochemical Analysis of Five Medicinal PlantsJohnson-Ajinwo Okiemute Rosa*, Nyodee, Dummene Godwin. Toxicity and Phytochemical Analysis of Five Medicinal Plants. Arch Pharm Pharma Sci. 2024: doi: 10.29328/journal.apps.1001054; 8: 029-040
-
Antibacterial Screening of Lippia origanoides Essential Oil on Gram-negative BacteriaRodrigo Marcelino Zacarias de Andrade, Bernardina de Paixão Santos, Roberson Matteus Fernandes Silva, Mateus Gonçalves Silva*, Igor de Sousa Oliveira, Sávio Benvindo Ferreira, Rafaelle Cavalcante Lira. Antibacterial Screening of Lippia origanoides Essential Oil on Gram-negative Bacteria. Arch Pharm Pharma Sci. 2024: doi: 10.29328/journal.apps.1001053; 8: 024-028.
Most Viewed
-
Evaluation of Biostimulants Based on Recovered Protein Hydrolysates from Animal By-products as Plant Growth EnhancersH Pérez-Aguilar*, M Lacruz-Asaro, F Arán-Ais. Evaluation of Biostimulants Based on Recovered Protein Hydrolysates from Animal By-products as Plant Growth Enhancers. J Plant Sci Phytopathol. 2023 doi: 10.29328/journal.jpsp.1001104; 7: 042-047
-
Sinonasal Myxoma Extending into the Orbit in a 4-Year Old: A Case PresentationJulian A Purrinos*, Ramzi Younis. Sinonasal Myxoma Extending into the Orbit in a 4-Year Old: A Case Presentation. Arch Case Rep. 2024 doi: 10.29328/journal.acr.1001099; 8: 075-077
-
Feasibility study of magnetic sensing for detecting single-neuron action potentialsDenis Tonini,Kai Wu,Renata Saha,Jian-Ping Wang*. Feasibility study of magnetic sensing for detecting single-neuron action potentials. Ann Biomed Sci Eng. 2022 doi: 10.29328/journal.abse.1001018; 6: 019-029
-
Pediatric Dysgerminoma: Unveiling a Rare Ovarian TumorFaten Limaiem*, Khalil Saffar, Ahmed Halouani. Pediatric Dysgerminoma: Unveiling a Rare Ovarian Tumor. Arch Case Rep. 2024 doi: 10.29328/journal.acr.1001087; 8: 010-013
-
Physical activity can change the physiological and psychological circumstances during COVID-19 pandemic: A narrative reviewKhashayar Maroufi*. Physical activity can change the physiological and psychological circumstances during COVID-19 pandemic: A narrative review. J Sports Med Ther. 2021 doi: 10.29328/journal.jsmt.1001051; 6: 001-007

HSPI: We're glad you're here. Please click "create a new Query" if you are a new visitor to our website and need further information from us.
If you are already a member of our network and need to keep track of any developments regarding a question you have already submitted, click "take me to my Query."


