Figure 6
The master regulator gene PRDM2 controls C2C12 myoblasts proliferation and Differentiation switch and PRDM4 and PRDM10 expression
Bartollino Silvia*, Di Zazzo Erika and Moncharmont Bruno
Published: 25 September, 2017 | Volume 1 - Issue 1 | Pages: 075-091
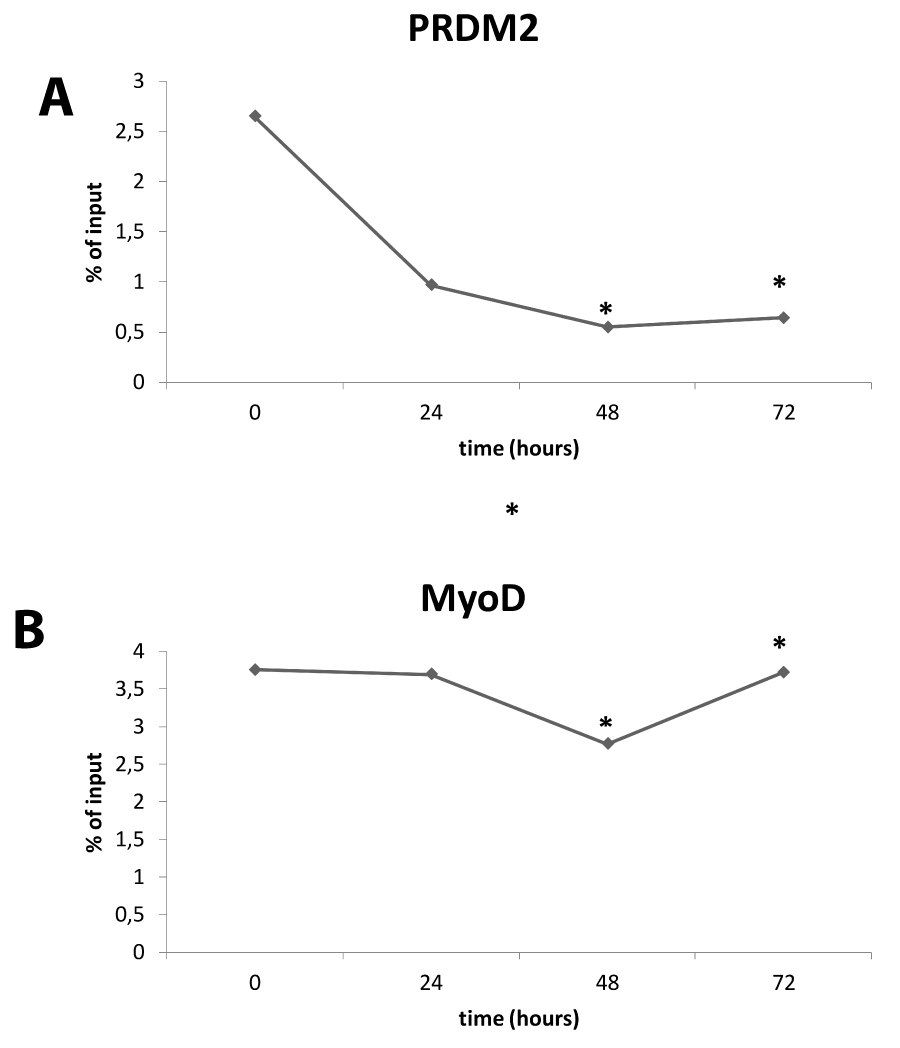
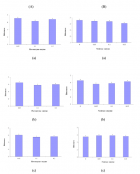
Figure 6:
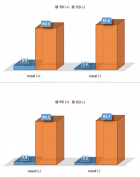
6: Interaction of RIZ with E1/E2 promoter. ChIP analysis of E2/E1 myogenin promoter region. Densitometric analysis of bands amplified from ChIP samples with antibodies to RIZ1 (upper panel) or to MyoD (lower panel), expressed as percentage of the input after background subtraction. The graph is representative of three independent experiment (* indicates p < 0.05 vs control).
Read Full Article HTML DOI: 10.29328/journal.hjbm.1001007 Cite this Article Read Full Article PDF
More Images
Similar Articles
-
The master regulator gene PRDM2 controls C2C12 myoblasts proliferation and Differentiation switch and PRDM4 and PRDM10 expressionBartollino Silvia*,Di Zazzo Erika,Moncharmont Bruno. The master regulator gene PRDM2 controls C2C12 myoblasts proliferation and Differentiation switch and PRDM4 and PRDM10 expression. . 2017 doi: 10.29328/journal.hjbm.1001007; 1: 075-091
-
Maternal thyroid dysfunction and neonatal cardiac disordersAhmed RG*. Maternal thyroid dysfunction and neonatal cardiac disorders. . 2017 doi: 10.29328/journal.ibm.1001008; 1: 092-096
Recently Viewed
-
Navigating Neurodegenerative Disorders: A Comprehensive Review of Current and Emerging Therapies for Neurodegenerative DisordersShashikant Kharat*, Sanjana Mali*, Gayatri Korade, Rakhi Gaykar. Navigating Neurodegenerative Disorders: A Comprehensive Review of Current and Emerging Therapies for Neurodegenerative Disorders. J Neurosci Neurol Disord. 2024: doi: 10.29328/journal.jnnd.1001095; 8: 033-046
-
Metastatic Brain Melanoma: A Rare Case with Review of LiteratureNeha Singh,Gaurav Raj,Akshay Kumar,Deepak Kumar Singh,Shivansh Dixit,Kaustubh Gupta*. Metastatic Brain Melanoma: A Rare Case with Review of Literature. J Radiol Oncol. 2025: doi: 10.29328/journal.jro.1001080; 9: 050-053
-
Validation of Prognostic Scores for Attempted Vaginal Delivery in Scar UterusMouiman Soukaina*,Mourran Oumaima,Etber Amina,Zeraidi Najia,Slaoui Aziz,Baydada Aziz. Validation of Prognostic Scores for Attempted Vaginal Delivery in Scar Uterus. Clin J Obstet Gynecol. 2025: doi: 10.29328/journal.cjog.1001185; 8: 023-029
-
Scientific Analysis of Eucharistic Miracles: Importance of a Standardization in EvaluationKelly Kearse*,Frank Ligaj. Scientific Analysis of Eucharistic Miracles: Importance of a Standardization in Evaluation. J Forensic Sci Res. 2024: doi: 10.29328/journal.jfsr.1001068; 8: 078-088
-
A study of coagulation profile in patients with cancer in a tertiary care hospitalGaurav Khichariya,Manjula K*,Subhashish Das,Kalyani R. A study of coagulation profile in patients with cancer in a tertiary care hospital. J Hematol Clin Res. 2021: doi: 10.29328/journal.jhcr.1001015; 5: 001-003
Most Viewed
-
Evaluation of Biostimulants Based on Recovered Protein Hydrolysates from Animal By-products as Plant Growth EnhancersH Pérez-Aguilar*, M Lacruz-Asaro, F Arán-Ais. Evaluation of Biostimulants Based on Recovered Protein Hydrolysates from Animal By-products as Plant Growth Enhancers. J Plant Sci Phytopathol. 2023 doi: 10.29328/journal.jpsp.1001104; 7: 042-047
-
Sinonasal Myxoma Extending into the Orbit in a 4-Year Old: A Case PresentationJulian A Purrinos*, Ramzi Younis. Sinonasal Myxoma Extending into the Orbit in a 4-Year Old: A Case Presentation. Arch Case Rep. 2024 doi: 10.29328/journal.acr.1001099; 8: 075-077
-
Feasibility study of magnetic sensing for detecting single-neuron action potentialsDenis Tonini,Kai Wu,Renata Saha,Jian-Ping Wang*. Feasibility study of magnetic sensing for detecting single-neuron action potentials. Ann Biomed Sci Eng. 2022 doi: 10.29328/journal.abse.1001018; 6: 019-029
-
Pediatric Dysgerminoma: Unveiling a Rare Ovarian TumorFaten Limaiem*, Khalil Saffar, Ahmed Halouani. Pediatric Dysgerminoma: Unveiling a Rare Ovarian Tumor. Arch Case Rep. 2024 doi: 10.29328/journal.acr.1001087; 8: 010-013
-
Physical activity can change the physiological and psychological circumstances during COVID-19 pandemic: A narrative reviewKhashayar Maroufi*. Physical activity can change the physiological and psychological circumstances during COVID-19 pandemic: A narrative review. J Sports Med Ther. 2021 doi: 10.29328/journal.jsmt.1001051; 6: 001-007

HSPI: We're glad you're here. Please click "create a new Query" if you are a new visitor to our website and need further information from us.
If you are already a member of our network and need to keep track of any developments regarding a question you have already submitted, click "take me to my Query."


